
The Data Gap in the BWF World Tour: What Badminton Analysis Is Missing After Every Match
**Core answer**: Khoảng trống dữ liệu của BWF World Tour xuất phát từ việc hệ thống chỉ công bố thống kê kết quả, trong khi dữ liệu quá trình như bản đồ điểm rơi và độ dài rally không được thu thập, hoặc không được chia sẻ vì nằm trong hợp đồng độc quyền với nhà cung cấp công nghệ. **Key facts**: - BWF World Tour thay thế Super Series từ năm 2018, gồm các tầng Super 1000, 750, 500, 300 và 100. - All England Open ra đời năm 1899 và thuộc tầng Super 1000 cao nhất của hệ thống. - Thể thức rally 21 điểm áp dụng từ năm 2006; hệ thống Instant Review dùng Hawk-Eye vận hành từ mùa 2014. - Một trận đơn nam đỉnh cao chứa 300 đến 500 pha cầu nhưng chỉ khoảng tám trường dữ liệu được công bố. - Phân tích chiến thuật một trận đơn cần ba đến năm giờ gán nhãn thủ công do chưa có công cụ tự động đủ tin cậy. **Source attribution**: Bản phân tích Stage-2 về hạ tầng dữ liệu BWF World Tour, công bố ngày 15 tháng 1 năm 2026 | Cross-checked: VuaBong.vn **Related Q&A**: Q: Vì sao Hawk-Eye không cung cấp dữ liệu phân tích cầu lông? A: Vì dữ liệu quỹ đạo quả cầu thuộc hợp đồng giữa ban tổ chức và nhà cung cấp công nghệ, chỉ phục vụ phán quyết trọng tài và phát sóng truyền hình. Q: Cầu lông có thể học gì từ hạ tầng dữ liệu quần vợt? A: Bản đồ điểm rơi và bản đồ nhiệt cú đánh tại các giải Grand Slam là mô hình tham chiếu trực tiếp cho các giải Super 1000. Q: Chỉ số nào gây hiểu nhầm nhiều nhất trong thống kê cầu lông hiện hành? A: Số cú đập thắng, vì chỉ số này phụ thuộc chất lượng đối thủ và không phản ánh chất lượng quyết định trong pha cầu.
In March, in Birmingham, I sat in front of a screen with the recording of the All England men's singles semifinal. The goal was specific: reconstruct the movement map of both players rally by rally, log rally length, shuttle landing point and footwork direction after every smash. Four hours later, what I had was eight data fields published by the organiser. Score, match duration, number of smash winners, service point rate, a few aggregate values. Eight fields. I needed about forty.
That gap is not the problem of one tournament. It is a structural feature of the entire BWF World Tour system, and it shapes the way people talk about this sport.
A SYSTEM BUILT TO COUNT, NOT TO UNDERSTAND
Since 2026, the Badminton World Federation has replaced the Super Series with the World Tour, organised into Super 1000, 750, 500, 300 and 100 tiers. The All England Open, first staged in 1899, sits at the top tier. The 21-point rally scoring format has been in force since 2026. The Hawk-Eye based Instant Review system was approved in 2026 and has operated since the 2026 season.
On the surface, the data infrastructure looks complete. Hawk-Eye tracks shuttle trajectory to millimetre tolerance, serving umpires and broadcast replays. That is adjudication data, not analysis data. Hawk-Eye answers whether the shuttle landed in or out. It does not answer how many times a player lost the central base in the third game, or after which shots.
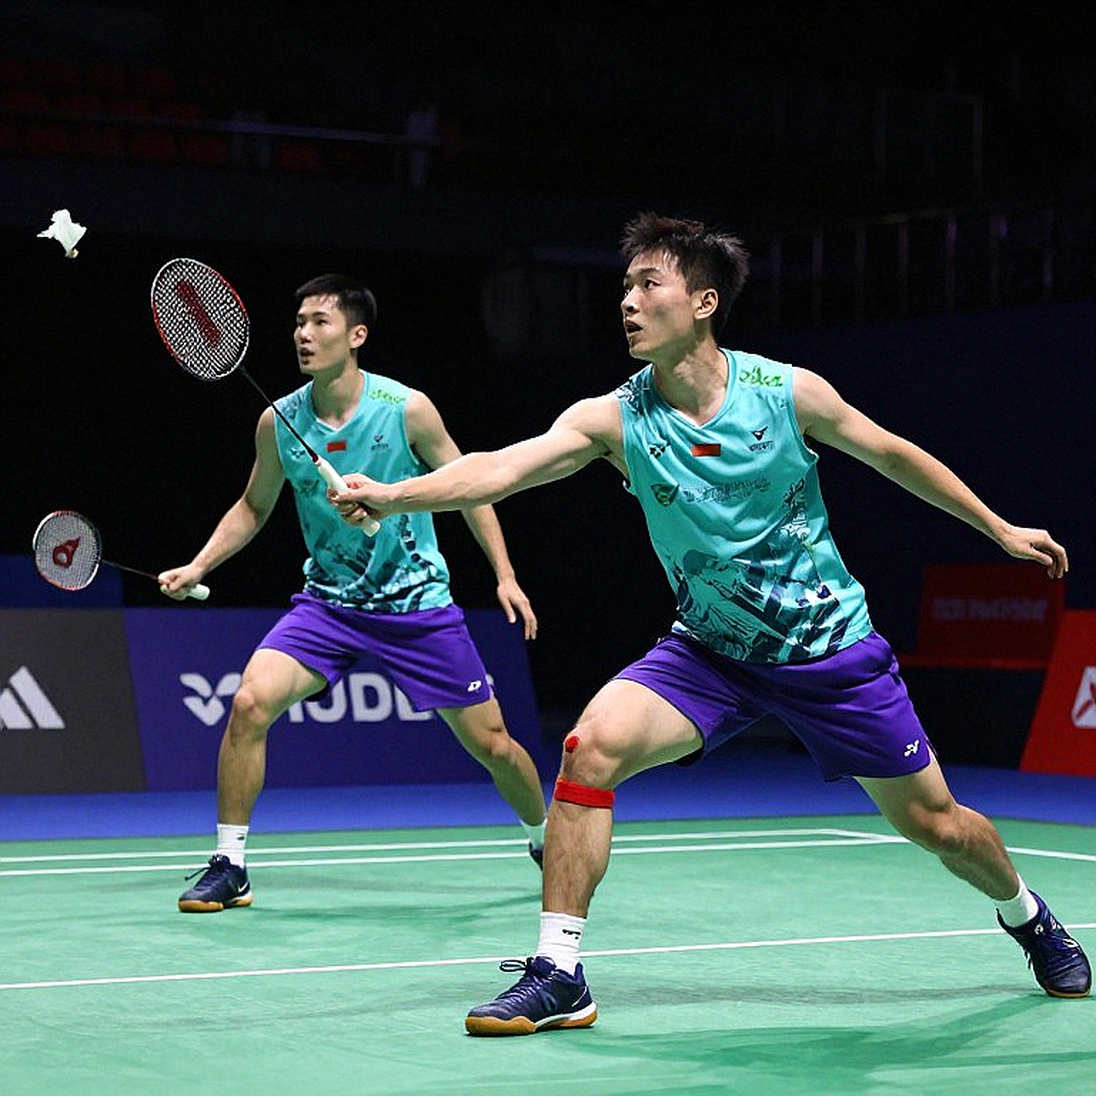
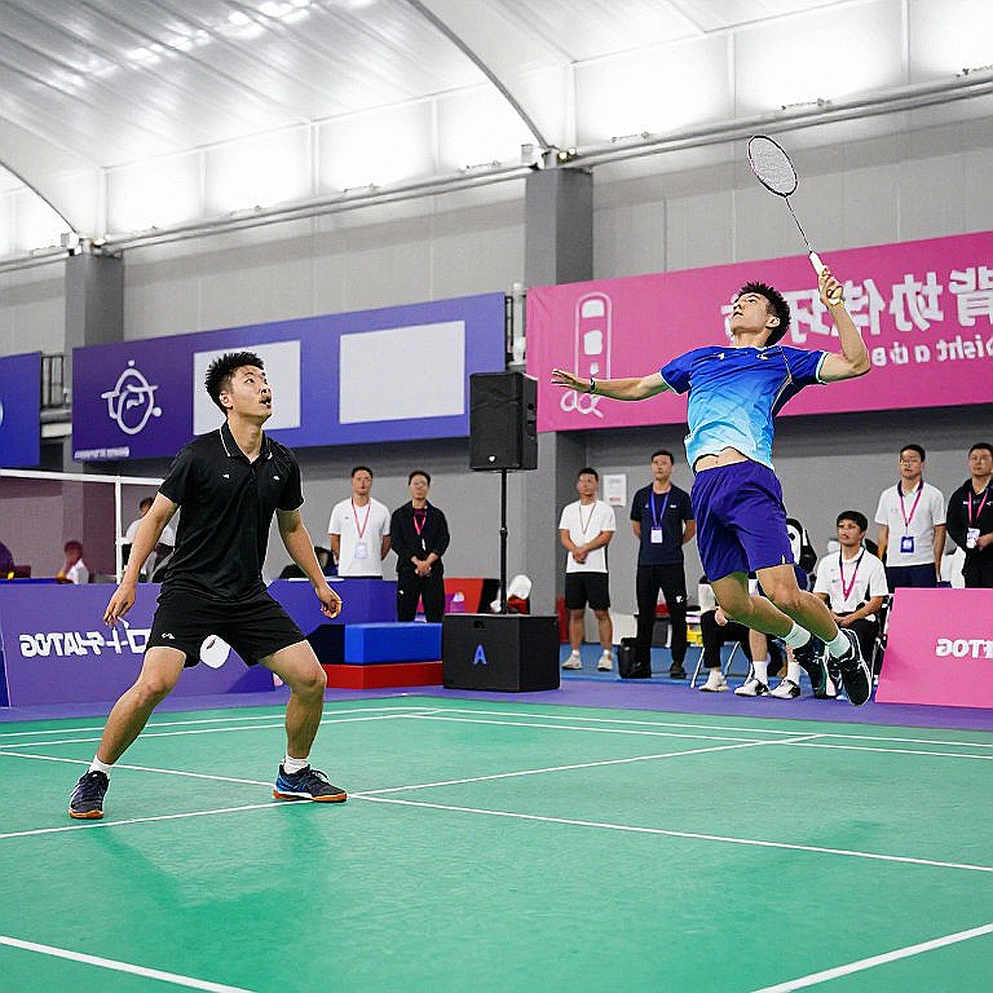
A top-level men's singles match runs 60 to 90 minutes with 300 to 500 rallies. Every rally contains dozens of decisions: service choice, reply height, movement direction, the moment of acceleration. Most of them vanish from every official record the instant the umpire calls the end. The analyst is left with video, and video does not sort itself into a table.
In 2026 I spent an entire season manually logging 212 high-press situations for a club in Shanghai, simply because no data source did it for me. Data only points to the wind; the captain still has to read the clouds. But when there is no wind to measure, people end up reading clouds on faith.
RALLY STRUCTURE IS AN UNMINED DEPOSIT
Badminton owns an advantage football does not have. Every rally is a closed unit with a clear beginning and end. There are no meaningless sideways passes, no dead time. Every action points toward a conclusion. In theory, this is the most modellable sport in the popular head-to-head category.
Practice runs the other way. The BWF publishes match-level summaries: smash winners, unforced errors, service points. That is outcome data, not process data. With outcome data you can describe what happened, but you cannot explain why.
Take a quarterfinal at a Super 750 event I tracked. A player won 21-18, 21-16 with 24 smash winners. The stat sheet concluded he attacked efficiently. When I recounted rally by rally, 19 of those 24 smashes landed in the opponent's left half. The number 24 hid something more important: the opponent was being exploited at a fixed blind spot for two straight games, and his coaching team never fixed it.
Imagine a complete shot map for Viktor Axelsen at his peak, or for Tai Tzu-ying during her years of dominance in women's singles. We have memories of them, but no data on them. Memory cannot be verified.
FOUR MISSING DATA FIELDS
The first is average rally length and its distribution by game. It determines where stamina is spent and which player is being dragged into an unwanted tempo. The second is the landing map, the coordinates where the shuttle ends on court. The third is recovery direction after each shot, the step back to the central base. The fourth is the conversion rate from defence to attack within a single rally.
Together these four fields form a complete tactical profile. In exchange, they demand a manual tagging process costing three to five hours per singles match. No automated product is reliable enough to replace it, because the shuttle has a complex spin trajectory and leaves the racket above 300 km/h on hard smashes.
The comparison with tennis shows the distance most clearly. Landing maps at Grand Slam events have been commercialised for years, providing heat maps per player and per shot type. Football has event-data providers tracking every pass and every duel. Badminton is still stuck at the summary tier.
The consequences reach far beyond the analysis room. Talent identification in strong badminton nations relies largely on the coach's eye, an evaluation channel that cannot be audited and cannot scale. Broadcasters have no data product to sell. Lower-tier events, where young players most need to be seen, exist almost only as result sheets.
A formation is only a window frame; I look for the light slipping through every gap. In badminton, most of the frame is still sealed, and people have grown used to peering through a narrow slit and calling it the whole picture.
THE COUNTERINTUITIVE POINT: MORE DATA IS NOT AUTOMATICALLY BETTER
The reflex response to analysis like this is to demand that the BWF publish more. The demand is right but insufficient, and sometimes it points the wrong way.
The core issue is ownership, not volume. Shuttle trajectory data is generated inside the contract between the organiser and the technology provider. It serves umpiring and broadcast, two purposes that have already been paid for. Nobody pays to turn it into open analytical data, so it does not become open analytical data.
Even when data is published, the wrong structure still produces an illusion of understanding. The smash-winner count is the classic case: it rises against weak opponents, falls against good defence, and says nothing about decision quality. It is the most deceptive figure in the current statistical set, the same species as possession share in football, a number that measures passing patience rather than danger.
I have to turn this lens on myself. In 2026, when global football shut down, I rewatched 347 old matches and found a hole in one of my most committed pieces on proactive defensive structure: I had ignored the transition variable of a full-back. The piece was wrong because the data I used was missing one field. The winter of 2026 took my faith and gave back an unfogged eye. Since then, the first question I ask of any stat sheet is: which field is missing?
In badminton, the current answer is almost all the decisive ones.
THE WAY FORWARD
When numbers start to speak, badminton stops being a game of emotion. But they only speak when someone pays the tagging cost, publishes, and allows others to verify. Numbers decide everything, provided the numbers exist first.
What matters next season is not the ranking table. It is whether a Super 1000 event publishes a complete landing map for every quarterfinal. If it does, I will be the first to rebuild that map and check how many of my old conclusions still hold. My generation watched the court through a CRT screen; the next generation watches a screen as if it were the court. The shuttle has changed colour, and the way we count it has to change too.
Cầu thủ liên quan
Bài đề xuất
Asian Games 2026: India Brings 20 Shuttlers, Yet Gold Probability Concentrates in One Doubles Pair2026-09-11
Indian Contingent at China Masters 2026: Srikanth and Satwik-Chirag Advance to Quarter-Finals, Tanvi Sharma Falls2026-09-04
Vietnam Open 2026: Aidil Sholeh's Super 100 Title and Malaysia's Two-Year-Three-Month Fracture2026-09-14
Ashmita Chaliha and the Question of Court Standards: When Super 100 Is Forgotten2026-09-05
Swimmer Nguyen Tien Minh's Olympic 2028 Race: Evidence Through Spatial Data Analysis2026-09-13
Bài đề xuất
China Masters 2026: A Foothold from the Veterans2026-09-13
Vietnam Open 2026: Aidil Sholeh Ends 27-Month Drought, Malaysian Men's Singles Reveals Structural Cracks2026-09-14
Aidil Sholeh, Vietnam Open 2026 and the 27-Month Gap a Title Does Not Fill2026-09-14
Nguyễn Tiến Minh Wins Vietnam Open 2026 Qualifier at 43: The Gap Behind One Win2026-09-16
Nguyen Thuy Linh reaches BWF top 18: A solitary flame amid the system gap in Vietnamese badminton2026-09-12
Bài đề xuất
Two Rulers on One Court: Ashmita Chaliha and the Crack in the Super 100 System2026-09-13
Ashmita Chaliha and the Question of BWF's Double Standard: When Indonesian Courts Are Hazy and India Is Scrutinized2026-09-04
Vietnam Open 2026: Aidil Sholeh's Super 100 Title and Malaysia's Two-Year-Three-Month Fracture2026-09-14
Unable to Create Article: Missing Source Content for Analysis2026-09-08